



A sharp correction in precious metals shows why inflation alone cannot sustain a rally. Interest rates, the dollar and investment flows will determine whether lower prices attract durable demand.
Gold and silver are confronting an uncomfortable reality: rising inflation does not automatically translate into rising precious-metal prices. As of October 26, the supplied market figures place gold near $4,005 an ounce and silver around $54—approximately 28% and 55% below their respective January records.
The scale of these declines challenges a familiar investment narrative. Inflation may strengthen the argument for owning assets that preserve purchasing power, but market prices also reflect the cost of holding them. Neither gold nor silver pays interest. When bonds offer attractive yields and the dollar remains firm, precious metals face stronger competition for investors’ money.
The immediate question is therefore not simply whether inflation remains elevated. It is whether inflation will keep monetary policy restrictive—and whether physical demand can absorb continued investment selling.
The Interest-Rate Hurdle
September US consumer inflation is reported at 3.7%, with core inflation at 2.6%. The Federal Reserve’s policy rate stands at 3.75%–4.00%, while the 10-year Treasury yield reportedly reached approximately 5.3% in early October.
Those figures describe a difficult backdrop for precious metals, but they require careful interpretation. A nominal Treasury yield does not, by itself, establish the level of real yields. That requires an inflation-adjusted measure, such as Treasury Inflation-Protected Securities yields, or a consistent estimate of expected inflation.
The defensible conclusion is narrower: elevated nominal yields and expectations of restrictive monetary policy are creating competition for non-interest-bearing assets.
Inflation influences gold through the policy response it provokes. If persistent price pressures delay rate cuts or encourage further tightening, gold can struggle even as the cost of living rises. Its appeal as a long-term store of value does not guarantee protection over every shorter market cycle.
Gold Returns to a Critical Area
Gold’s price structure reflects that pressure. The metal has traded broadly between $4,000 and $4,700 since June, including a brief move below $4,000 in late June. It is now back near the lower end of that range.
The immediate area to watch is $3,978–$4,000. A sustained weekly close below this zone would suggest that recent buying interest has failed to hold, although no technical threshold guarantees the direction or size of the next move.
Above current prices, resistance lies around $4,132–$4,275, followed by $4,320–$4,450. Published technical commentary cited in the underlying material places the 200-day moving-average area near $4,500–$4,540.
These are reference points, not precise forecasts. A rebound from $4,000 would be less convincing than a recovery that progressively reclaims higher resistance levels. Likewise, a proposed buying zone around $3,800–$3,900 should be understood as an analytical estimate, not an established floor.
Silver’s Deeper Setback
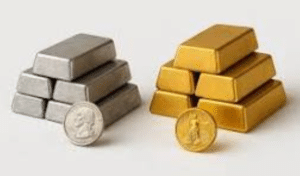
Silver’s correction has been substantially more severe. Prices fell from approximately $61 on October 1 to around $54, while the gold-to-silver ratio widened from 68.4 to about 74.
The ratio measures how many ounces of silver equal the price of one ounce of gold. Its increase shows that silver has underperformed gold over this period.
Silver combines monetary demand with substantial industrial exposure. This creates more than one potential source of support, but also more than one vulnerability. Investment selling can coincide with weaker fabrication demand, leaving prices exposed even when longer-term supply forecasts appear favourable.
Immediate technical support is around $53–$53.80, with resistance near $56.65–$58 and then $60–$61. The $49.45 level, associated with silver’s nominal 1980 record, is another historical reference. Its significance does not establish that buyers must return there.
Why a Deficit Is Not a Price Floor
Supply remains central to silver’s investment case. Figures attributed to the Silver Institute project a 46.3-million-ounce deficit in 2026, potentially the sixth consecutive annual shortfall.
Projected demand is approximately 1,112.6 million ounces against supply of 1,066.4 million ounces. Industrial fabrication is forecast to decline about 2% to roughly 650 million ounces, partly because solar manufacturers are reducing silver use per cell.
The distinction between an annual deficit and an immediate shortage is essential. A deficit means current supply falls short of current demand. It does not establish how much accessible inventory remains, how readily holders will sell, or the price required to release that metal.
Existing stocks and investment liquidation can bridge the gap. Persistent deficits may strengthen the longer-term case, but their price impact depends on inventories, recycling, substitution and investor behaviour.
Silver’s decline demonstrates why a favourable supply narrative cannot eliminate cyclical risk.
Central Banks and Investors Pull Apart
Gold’s demand picture is similarly divided. World Gold Council figures cited in the supplied material show central-bank purchases of 289 tonnes in the second quarter, up 62% year on year, alongside 45 tonnes of net exchange-traded fund outflows.
These represent different investment decisions. Central banks may accumulate gold for reserve diversification over long horizons. ETF investors can respond more quickly to changes in yields, currencies and market confidence.
Official purchases can therefore support demand without preventing a correction. They do not create a guaranteed floor when financial investors are reducing exposure.
A more useful signal would be a sustained improvement in ETF flows alongside continued central-bank buying. That combination would indicate broader demand rather than reliance on one category of buyer.
India’s Demand Faces Competing Forces
For Indian buyers, the international dollar price tells only part of the story. The supplied figures report an increase in the effective import duty on gold and silver from 6% to 15% in May, alongside rupee weakness.
Both can offset a decline in international prices. A cheaper dollar-denominated ounce does not necessarily produce an equivalent reduction in domestic acquisition costs.
An estimate attributed to the World Gold Council suggests the duty increase could reduce annual gold demand by 50–60 tonnes. Festive purchases may provide seasonal support, but that should not be confused with an assured recovery.
Affordability, household budgets and expectations of further price declines remain important. Domestic demand must be assessed through local prices, not international headlines alone.
Scenarios Rather Than Promises
A reasonable scenario framework places year-end gold between $3,900 and $4,250 and silver between $48 and $60 if monetary policy remains restrictive without a further substantial deterioration in financial conditions.
A weaker outcome could take gold toward $3,750–$3,850 and silver toward $45–$50. An improving environment could support gold around $4,320–$4,500 and silver around $60–$64.
These are conditional analytical ranges, not statistically established outcomes. Their usefulness lies in linking prices to developments that can be monitored: interest-rate expectations, the dollar, investment flows and physical demand.
Gold needs evidence that financial conditions are becoming less restrictive. Silver needs that improvement alongside resilient industrial and investment demand. Until those conditions emerge, the distance below a previous peak measures the size of the correction—not the certainty of a bargain.

