



The Nifty has fallen seven weeks in a row. From its January closing high of 26,328.55, it stood at 22,621.30 on 29 September, a 14.1% drawdown. Brent is hovering between $100 and $106. The US 10-year yield sits near 5.24%. The September series alone wiped off 5.67%. The usual explanations are circulating: tax changes, GDP prints, and domestic sentiment. They are secondary. The real pressure is external: higher US yields and elevated crude, and the historical record is more nuanced than the market’s current mood suggests.
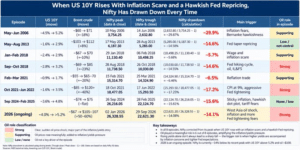
This is not the first time the combination has appeared. Since 2006 there have been seven completed episodes in which US 10-year yields rose on inflation concerns and Fed repricing. An eighth is underway. Peak-to-trough declines in the Nifty, measured on closing levels, ranged from 5.7% to 29.9%. The median was 14.6%. The current 14.1% decline already sits near the middle of that range. It is neither an outlier waiting for a deeper collapse nor proof that the worst is behind us.
Look at the episodes. In May to June 2006, yields moved from 4.5% to 5.2% and the Nifty fell 29.9%; oil played a supporting role. In May to August 2013, yields rose from 1.6% to 2.9%, and the index dropped 14.6%; oil was largely absent. January to February 2018 saw a milder 5.7% decline as yields climbed from 2.4% to 2.9%. September to October 2018 produced another 14.6% fall, with oil as a strong driver. February to March 2021 brought a 6.5% correction. The long grind from October 2021 to June 2022 delivered a 17.2% drawdown amid a sharp rise in both yields and crude. The September 2024 to February 2025 episode saw yields climb from 3.6% to 4.8% and the Nifty fall 15.6% with little oil contribution. The current move, yields from around 4% to above 5.2%, has so far produced a 14.1% decline, with oil again in a strong supporting role.
The average completed drawdown is 14.9%. Strip out the 2006 outlier, and it falls to 12.4%. The present decline is therefore typical, not extreme.
The popular claim that “the Nifty falls every time yields and oil rise” is true only by construction. A peak-to-trough measure cannot produce a positive number. Drawdowns of 5% to 15% occur in most years for many reasons. A proper test would examine every period in which yields and oil rose together and record what the Nifty actually did. That control group is missing from most commentary. One inconvenient case is already on the record. In September to October 2023 the US 10-year touched 5% and Brent approached $95. The Nifty fell only about 6% to 7% and recovered its highs within weeks.
Oil is not the constant variable either. In some episodes it was central: autumn 2018, 2021 to 2022, and the present one. In others it was minor or absent, 2013 and 2024 to 2025. Yet the drawdowns without a meaningful oil shock (14.6% and 15.6%) were comparable to those with one (14.6% and 17.2%). Some classifications are debatable. Brent peaked near $70 in late January 2018 and then declined through the February sell-off, so any supporting role for oil that month is open to question.
\
Domestic factors also differed across episodes. 2006 involved the unwinding of a leveraged domestic rally. 2013 was dominated by a current-account and rupee crisis. 2024 to 2025 saw record foreign selling and earnings downgrades. Attributing every correction solely to the US-yield-plus-oil pair overstates the case. The common thread is US rates, dollar liquidity and foreign portfolio flows.
India’s sensitivity is structural. Higher US yields raise the relative return on the safest global asset. Foreign investors reduce emerging-market exposure as a relative-return decision, not merely a rotation into US equities. India imports roughly 88% of its crude. Sustained higher oil widens the current-account deficit and pressure the rupee, reinforcing foreign selling. Higher fuel costs feed into inflation and limit the RBI’s room to ease, which in turn lifts domestic bond yields. Valuation adds another layer. The Nifty’s earnings yield of 5.11% now sits below the US 10-year at 5.23% and the 30-year at 5.48%. Equities offer less earnings yield than US government paper, and that gap compresses multiples.
Two features make 2026 different from the cleaner historical analogies. First, the oil shock has been volatile rather than a steady climb. Brent fell to $73.74 in late June, its lowest since before the escalation that began at the end of February, and its 52-week range runs from $58.72 to $126.41. Today’s level reflects a renewed spike, not the smooth rise from $67 that summary tables sometimes imply. Second, the January peak in the Nifty predates the latest oil surge. Part of the 14% decline reflects earlier valuation and earnings concerns. Separating the two cleanly is difficult. Any claim to do so overreaches. The yield regime itself is also higher than in 2018 or 2022, with the 30-year at multi-decade highs, so valuation sensitivity is greater.
A common conclusion is that the Nifty cannot recover until yields and oil ease. The record contradicts the timing. In 2013 the Nifty bottomed on 28 August while US yields continued rising into year-end. In 2018 the low came on 26 October, close to the peak in the US 10-year. In 2022 the low arrived on 17 June, months before yields peaked in October. Equity markets typically discount the peak in pressure, not its resolution. Waiting for confirmation that conditions have ended has historically meant buying well above the low. Assuming the fall must continue until yields turn is equally unsupported by the data.
The indicators that matter are straightforward: the direction of Brent on a sustained basis rather than headline spikes tied to negotiations; the pace of increase in the US 10-year and 30-year, not only the absolute level; foreign portfolio flows, which have led turning points before; the rupee and the current-account outlook; and the earnings-yield gap to US Treasuries, which can narrow through either higher earnings or lower prices.
Higher US yields and elevated oil are a genuine source of pressure on Indian equities. The historical record supports three modest conclusions. Corrections are likely in such environments. Their depth varies widely. The current 14% decline is already typical. It does not support a rule that the Nifty falls every time, or that it cannot rise until the external conditions reverse. The economy is not the variable in question. Market pricing is, and it typically turns before the headlines do.

