



On 15 August 1971, the United States closed the gold window, ending the convertibility of the dollar into gold at a fixed price and marking the effective collapse of the Bretton Woods system established in 1944. Fifty-five years later, US long-term interest rates have returned to levels last sustained in the early 2000s: the 30-year Treasury yield stands near 5.5–5.6 percent and the 10-year near 5.2 percent. Headline CPI is approximately 3.4 percent, core CPI closer to 2.4 percent, and the Federal Reserve has resumed rate increases, producing a positive real policy rate.
For Indian investors, the relevant question is not motive but mechanism. US fiscal and monetary cycles transmit to India through four primary channels—currency and capital flows, energy prices, trade in intermediate goods, and technology spending. Understanding the historical pattern, the current configuration of yields and inflation, and the measurable indicators that govern each channel allows portfolios to price risk rather than react to narrative.
The Recurring US Cycle
Since 1946, the United States has repeated a sequence of fiscal expansion, monetary accommodation, rising inflation or asset prices, delayed but aggressive tightening, and subsequent real adjustment roughly seven times. Large spending programs or tax cuts are financed at low rates; excess liquidity elevates goods prices or asset valuations; the Federal Reserve eventually tightens, often after inflation has already accelerated; and the resulting higher real rates compress imbalances.
Historical illustrations are precise. In the late 1960s, Great Society outlays and Vietnam War spending lifted core inflation from roughly 1 percent toward 5 percent, straining the gold-dollar link until the 1971 closure. In 1979–82 Paul Volcker raised the federal funds rate to nearly 20 percent, attracting global capital, lifting the dollar 40–50 percent by 1985, and transforming the US trade deficit into a structural feature. The mid-1990s fiscal surpluses gave way to the Nasdaq collapse of nearly 80 percent after March 2000. From 2001 to 2015 the Fed’s balance sheet expanded from under $1 trillion to approximately $4.5 trillion. Pandemic-era stimulus added roughly $5 trillion to cumulative deficits; CPI peaked at 9.1 percent in June 2022, yet the first rate increase occurred only in March 2022.
The dollar’s role as the world’s primary funding and reserve currency ensures that these domestic adjustments spill across borders irrespective of intentional design.
Three Historical Transmission Episodes
The 1971 gold-window closure resolved an inconsistency between growing dollar claims and finite US gold reserves. Foreign central banks retained the formal right to convert dollars at $35 per ounce; when claims outpaced reserves, either US deflation or revaluation by surplus countries was required. Neither occurred at sufficient scale, and convertibility ended.
Volcker’s rate shock of 1979–82 demonstrated the capital-flow channel with particular clarity. Elevated US yields drew portfolio capital from the rest of the world, appreciated the dollar, and imposed adjustment costs on industrial exporters and emerging-market balance sheets.
The Plaza and Louvre Accords of 1985–87 illustrated that large currency realignments can involve coordination. By 1985 the dollar’s strength had produced record US trade deficits; the G5 agreed to orderly depreciation, later stabilized under Louvre. These were negotiated outcomes, not unilateral fiat.
Nuance versus Narrative
Several widely cited episodes are frequently oversimplified. Japan’s post-Plaza experience combined yen appreciation with domestic credit expansion; the subsequent bust followed the Bank of Japan’s own tightening in 1989–90 and structural banking weaknesses. Germany’s energy exposure to Russia involved long-standing US opposition to Nord Stream 2, yet Germany itself suspended certification in February 2022 and Russia curtailed volumes. China’s post-1978 reform trajectory, World Bank engagement from 1981, permanent normal trade relations in 2000, and WTO accession in December 2001 reflected policy choices by multiple parties, including China’s own tariff reductions and joint-venture technology requirements. India’s IT-services strength rests on WTO Information Technology Agreement participation from 1997 and the statutory H-1B cap of 85,000 new petitions annually, of which Indian nationals receive the majority—making US visa policy a direct revenue risk.
Deliberate instruments—sanctions, export controls, tariffs—constitute policy risks that can be quantified and hedged. Broader outcomes often reflect domestic political economy rather than coordinated design.
Current Configuration
Long-term yields at multi-decade highs reflect term premium, elevated Treasury supply, and residual inflation risk rather than classic financial repression (which requires sustained negative real rates). The 2-year yield near 4.9 percent against headline CPI of 3.4 percent produces a positive real short rate. Energy remains the principal driver of residual headline inflation; core measures are closer to target.
An additional medium-term risk is the AI-related capital expenditure cycle. Hyperscalers are funding data-center build-outs with increasing debt. As in the late-1990s telecom expansion, the sustainability of this spending depends on future revenue realization relative to today’s cost of capital. Relevant metrics include capital expenditure as a share of revenue, net debt issuance, credit spreads, and the level of long-term yields.
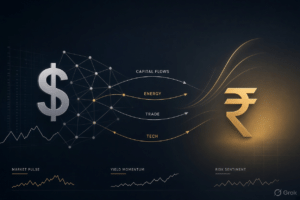
Four Transmission Channels to India
- Capital flows and the exchange rate. Rising US long yields raise the opportunity cost of holding emerging-market assets. Portfolio reallocation toward Treasuries can produce FPI outflows, rupee depreciation, and higher dollar-hedging costs for Indian corporates. The 2022 episode—aggressive Fed tightening, substantial equity outflows, and notable INR weakness—provides a recent template. Indicators: 10- and 30-year Treasury yields, USD/INR, and weekly FPI equity and debt flows.
- Energy prices and the Russian crude discount. Energy remains India’s largest external price variable. The discount on Urals crude has reduced the import bill, yet secondary-sanctions risk tied to Russian energy transactions has appeared in bilateral discussions. Tightening of compliance requirements could raise refining margins or force rerouting. Indicators: Brent, Urals differential, Indian refinery crude-slate data, and any new US guidance.
- Intermediate-goods dependence on China. India continues to import substantial volumes of electronics components, specialty chemicals, and solar inputs from China. US export controls or tariff measures applied to Chinese precursors can raise Indian input costs even when India is not the direct target. Indicators: customs data by HS chapter for electronics, chemicals, and solar, and the evolution of US entity-list or export-license regimes.
- US technology spending and Indian IT services. A material share of Indian IT and engineering-services revenue is linked to US corporate technology budgets. Higher long-term yields raise the cost of capital for hyperscalers and large tech firms, potentially moderating capital expenditure and discretionary outsourcing. Indicators: hyperscaler capex guidance, US tech capital expenditure as a percentage of sales, H-1B petition trends, and commentary from the large Indian IT companies on US revenue pipelines.
Practical Monitoring Framework
Six observable series capture the majority of near-term transmission risk:
- US 10-year and 30-year Treasury yields
- USD/INR and FPI flows
- Brent crude and the Russian discount
- India’s merchandise and services export growth
- Customs imports from China in key intermediate categories
- Hyperscaler capital-expenditure guidance
These series require no theory of intent; they are market and official statistics that update at high frequency.
The sensible posture: diversification, not confrontation The appropriate response is diversification of exposure rather than confrontation with the dollar system. Practical steps include broadening crude and intermediate-input sourcing, expanding rupee-settlement arrangements where counterparties accept them, and deepening domestic capital markets so that growth can be financed with local savings when global dollar liquidity tightens. Geopolitical cooperation among Russia, India, and China on payments remains constrained by India’s own strategic competition with China; portfolios should not assume otherwise.
US fiscal-monetary cycles will continue to propagate because the dollar remains the dominant funding currency. Indian investors cannot eliminate the weather pattern, but they can measure its intensity, identify the transmission routes, and adjust exposure before the next adjustment phase. The current configuration of elevated long yields, positive real rates, and residual inflation risk simply makes the measurement exercise more urgent.

