



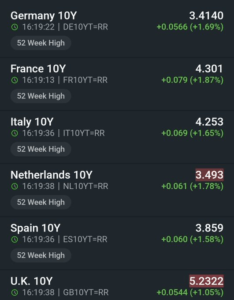
European sovereign yields have broken out to their highest levels since the euro crisis. The German 10 year Bund is trading near 3.4%, its highest since 2011, the French OAT is above 4.2%, its highest since 2008, and the OAT/Bund spread sits near 85 basis points. This is happening while the ECB is hiking, not cutting, with the deposit rate expected at 2.50% today and markets pricing roughly 3% by late 2027, and while the Fed under Chair Warsh is signalling that inflation has not slowed enough.
The popular version of the thesis says: deficits are too large, governments cannot afford these yields, so central banks will be forced to cut rates and restart QE while inflation is still high, and investors should therefore own hard assets. We agree with the destination. We disagree with the road. A central bank that cuts its policy rate into elevated inflation does not lower the government’s borrowing cost; it raises it, because the long end of the curve is priced by inflation expectations and term premium, not by the overnight rate. The United States demonstrated this in late 2024, when 100 basis points of Fed cuts coincided with a roughly 100 basis point rise in the 10 year Treasury yield.
Fiscal dominance, when it arrives, does not look like rate cuts. It looks like balance sheet intervention, regulatory demand for government bonds, and negative real yields engineered on the long end. That is the regime that rewards hard assets, and it is more damaging to bondholders than a simple easing cycle. The correct positioning is therefore not “central banks will cut, buy gold.” It is “central banks will lose control of the long end and respond with repression, own what repression cannot dilute.”
1. Where Europe Actually Stands
Three facts anchor the analysis.
First, the sell-off is inflation-driven, not yet solvency driven. Brent has revisited $100 on the Iran conflict, European gas is at multi year highs, and eurozone energy prices were running more than 14% above a year earlier in the latest flash print. Bund yields are moving broadly in line with global benchmarks. This is a rates repricing, and the ECB is responding the conventional way, by hiking.
Second, France is the fault line, not the eurozone as a whole. French gross debt is projected around 118% of GDP this year and rising, the 2026 deficit is expected near 5.2% of GDP, and the 2027 presidential election makes consolidation politically difficult. French 10 year yields have traded above Italy’s for much of the summer, a role reversal that would have been unthinkable five years ago. Italy and Spain, by contrast, have improved primary balances and their yields are at two to three year highs, not fifteen year highs.
Third, the “multi-decade” framing overstates the level. Bunds at 3.4% are at a fifteen year high, roughly where they traded through the 2000s. What is unprecedented is not the yield but the combination of that yield with debt stocks that are 30 to 50 percentage points of GDP higher than in 2011, a structurally larger issuance calendar, and an ECB that is no longer the marginal buyer.
2. The Arithmetic That Matters
The variable that decides whether a sovereign is on a stable path is the gap between the nominal growth rate and the effective interest rate on the debt stock, combined with the primary balance.
For most of the 2010s, European governments enjoyed r well below g. Debt could rise without the ratio exploding. That cushion is gone for France: nominal growth of roughly 3% against a marginal borrowing cost above 4% and a primary deficit near 3% of GDP is a combination that compounds the wrong way. Germany still has room; its debt ratio is in the low 60s, and its fiscal expansion is a choice rather than a trap.
Two things soften the near-term picture. The effective interest rate on the outstanding stock lags the marginal yield by years because of long average maturities, roughly eight years for France. And higher inflation raises nominal GDP, which is exactly why elevated inflation is tolerable for a debtor state and intolerable for a bondholder. The pressure is real, but it is a slow burn measured in years, not a cliff measured in quarters.
3. Why Rate Cuts Do Not Solve the Problem
This is the central correction to the thesis.
Governments do not borrow at the policy rate. France’s weighted-average issuance is in the seven- to ten-year sector. The yield on that sector is set by expected inflation over the horizon plus a term premium for uncertainty. If the ECB cut its deposit rate tomorrow with headline inflation elevated and energy prices rising, the market would read it as a decision to tolerate inflation. Breakevens would rise, the term premium would widen, and the ten-year yield would go up, not down. The short end would fall and the curve would steepen sharply.
The evidence is recent. Between September and December 2024, the Fed cut the funds rate by 100 basis points; the 10-year Treasury yield rose by approximately the same amount. The Bank of England has faced the same dynamic in the gilt market repeatedly since 2022. The mechanism is not controversial among rates practitioners; it is simply absent from the popular version of this thesis.
A second-order effect matters for Europe specifically. A premature cut weakens the euro, which raises imported energy costs, which feeds directly into the inflation problem that drove the sell-off in the first place. Cutting into an energy shock is a doom loop, not an escape.
So the honest statement is this: if the ECB or the Fed cuts rates while inflation is high, governments do not get cheaper financing. They get a steeper curve, a weaker currency, higher long term borrowing costs, and rising inflation expectations. That is worse for the sovereign, and it is the scenario in which real assets outperform most decisively.
4. What Fiscal Dominance Actually Looks Like
If rate cuts do not work, what does a central bank do when its government can no longer fund itself at market prices? It intervenes on the long end directly, and it does so in a sequence that history makes fairly predictable.
Stage one: targeted intervention. The ECB already has the Transmission Protection Instrument, which allows it to buy the bonds of a specific member state under fiscal stress without a broad QE programme. If the OAT/Bund spread widened toward 120 to 150 basis points, TPI activation for France would be the first move. This is not QE in the 2015 sense. It is a spread cap, and it would be presented as a financial stability measure, not a monetary one.
Stage two: balance sheet stops shrinking. Ending QT is the low-cost step. The ECB stops letting bonds roll off, reinvests maturities, and the marginal buyer returns. This can be justified under almost any inflation regime as “liquidity management.”
Stage three: regulatory demand. Governments do not need the central bank to buy bonds if they can compel banks, insurers, and pension funds to do so. Liquidity coverage rules, capital treatment of sovereign debt, and pension solvency frameworks are all levers. This is financial repression in its purest form: a captive investor base holding bonds at yields below inflation. It is quiet, it is politically easy, and it transfers wealth from savers to the state without a single headline.
Stage four: outright yield management. Only if stages one to three fail does a central bank move to explicit long-end purchases or yield caps while inflation is above target. This is the Japan 2016 to 2024 template, and it ends with a currency that has lost a third of its value.
The current European position is between stage zero and stage one. The ECB is hiking, QT is proceeding, and TPI has not been used. The thesis is about direction, and on direction it is correct. It is not about the next two quarters.
5. What This Means for Positioning
The regime being described is one of negative real yields on the long end, engineered rather than accidental, with nominal growth held above the cost of debt through inflation. In that regime the losers are holders of long-duration nominal claims in the affected currency: long government bonds, long investment-grade credit, and any pension or insurance liability matched with them. The winners are assets whose value is denominated in real terms and cannot be diluted by issuance.
This supports the hard asset conclusion, with three qualifications.
Gold is already pricing a substantial part of this. At roughly $4,400 an ounce, it has more than doubled since 2023, and its correlation with real yields has broken down precisely because it now trades as the anti-fiat asset rather than the anti real rate asset. It remains the cleanest expression of the thesis, but the entry point is not cheap.
Energy and energy infrastructure are the underowned leg. The proximate cause of the European sell-off is an energy shock, and the fiscal dominance path implies currency weakness in the deficit economies, which raises the local currency price of dollar-priced commodities. Producers with long reserve lives and low cost curves, and midstream assets with inflation-linked tariffs, benefit twice.
Duration should be short and floating, not simply avoided. In a repression regime, the short end is held down while the long end is allowed to drift; the trade is to own front-end and floating rate paper and to be short long-dated sovereigns in the weakest issuers, France most obviously.
For Indian investors, the transmission runs through three channels: the dollar (a weaker euro is a stronger dollar, which is a headwind for EM flows), crude (a direct terms of trade hit), and gold (a direct beneficiary, and a natural hedge for rupee holders against the first two). The domestic rate cycle is a secondary consideration next to these.
6. What Would Prove Us Wrong
We hold this view with conviction on direction and low conviction on timing. The following would force a revision.
If the Iran conflict resolves and Brent falls back below $75, the inflation impulse fades, the ECB pauses, and the long end rallies. The structural debt problem remains, but the acute phase is deferred by a year or more, and the hard asset trade gives back part of its gains.
If France passes a credible multi-year consolidation before the 2027 election, the OAT/Bund spread compresses, and the fault line moves elsewhere. We consider this unlikely but not impossible.
If nominal growth in the eurozone surprises to the upside, r minus g narrows without intervention and the arithmetic in Section 2 improves.
And the clearest falsifier: if a major central bank cuts into elevated inflation and long yields fall rather than rise, the mechanism in Section 3 is wrong and so is the sequencing in Section 4. We would expect the opposite, and we would treat a sustained bond rally on a premature cut as evidence against this entire framework.
Distinguishing Evidence from Inference
The yield levels, spread levels, debt ratios, deficit projections, and current central bank stances cited in Sections 1 and 2 are observable market and official data as of early September 2026. The mechanism in Section 3 is a strong inference supported by the 2024 US and post 2022 UK experience, but two episodes are not a law. The sequencing in Section 4 is a framework built from historical precedent, principally Japan and the euro crisis, and the stage assignments are our judgement. The positioning in Section 5 follows from the framework and inherits its uncertainty; the gold valuation comment in particular is a price opinion, not a forecast.

